

[EDITOR'S NOTE: Not advised for those who react violently when exposed to anything mathematical.]
I have never heard of a debutante receiving a rose on graphing paper.
I’m talking about a rose graphed on a coordinate plane, complete with an equation to go with it. This is something I encountered in one of my Calculus classes. But fear not!: While discussing the mathematics behind roses requires basic knowledge on Trigonometry and Calculus, I’ll instead show you how to graph roses on a graphing calculator.
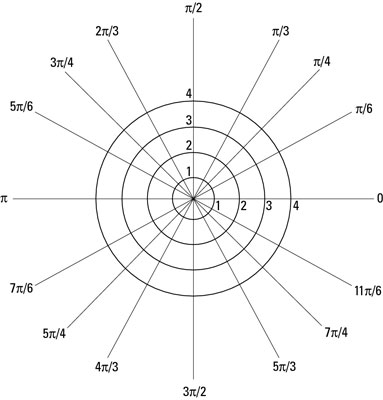
Roses are curves graphed on a polar coordinate plane. This is different from the Cartesian coordinate plane introduced to us in our algebra classes. Instead of plotting points using the x-axis and y-axis of a Cartesian plane, points are determined by identifying its distance from the pole (the plane’s center) and its angle from the polar axis (the plane’s horizontal axis). Here’s what one looks like:
The funny thing with these roses is that they barely look like roses. The images below show roses I graphed online. This could easily pass as a flower a four year old can draw with little difficulty. Still, it is pretty cute – and here’s how you can do it too!

Step 1: Think of an equation.
One does not simply graph a rose without an equation. It’s easy enough to think of one. You only need to know how many petals you want your rose to have and how long each petal should be. This is what the equation should look like, but with numbers replacing n, the number of petals of the rose, and a, the length of each petal:
Your rose would have the same number of petals if you choose n to be an odd number. If n is an even number, your rose will have twice as much petals.
Let’s say you want to make a rose with 5 petals, each having a length of 2. The equation you’ll end up with should either be r = 2sin(5θ) or r = 2cos(5θ). The only difference between these two equations is that one appears to be more tilted than the other.


What about a rose with 16 petals, each being of length 3? The equations you should have can either be r = 3sin(8θ) or r = 3 cos(8θ).


Step 2: Find a graphing calculator that can plot polar curves.
Again, the rose is a polar curve and is therefore graphed on a polar coordinate plane. You’ll need a graphing calculator that will allow you to graph on one. I don’t own a graphing calculator myself, so I usually use FooPlot and Desmos. After finding one, set the calculator to Polar. Some calculators, such as Desmos, may require you to include “r =” before the equation instead of indicating what type of function you’ll be graphing.
Step 3: Input the equation, and voila!
Once you have an equation and graphing calculator ready, all that is left to do is graph the equation.
You might be wondering how to input this character: θ. This is theta, a Greek letter used to represent angles. On online graphing calculators, you only need to type the word “theta” to complete the equation. A rose should appear on the graphing calculator after entering the equation.
If you want your rose to resemble an actual rose more, substitute n with e (the natural logarithm), pi or √2.
This gift is perfect for people who can’t seem to get enough of math. If you’ll be attending a debut soon, get those eighteen equations and give the debutante a bouquet of roses on graphs!
Kase, Elleyne, and Kuang, Yang. “How to Plot Polar Coordinates.” For Dummies. Pre-Calculus For Dummies, 2nd Edition, June 2012. Web. n. d. <http://www.dummies.com/how-to/content/how-to-plot-polar-coordinates.html>.
“Roses.” Wolfram Mathworld. n.p., n.d. Web. < http://mathworld.wolfram.com/Rose.html>.
Article and rose images by Andie
Artwork by Gaby
----

Science has been Andie’s thing since she was four (she once thought the Milky Way was the gateway to heaven). She doesn’t mind being called a geek—because it’s obviously true—and is now a physicist in the making. She believes her puns, jokes and pick-up lines are amazing, even if everyone else around her doesn’t. Andie constantly thirsts for adventure, and is ready to give almost anything a try.


This is the may just be the geekiest, and yet best thing ever. Loved the article!!!
ReplyDelete[From: A person who reacts violently to anything mathematical]